Introduction
In “How to Visualize Open Source Community Data”, we introduced how to fetch data through the GitHub GraphQL API and visualize and display the data using MySQL and Grafana Dashboards.
This article will continue this topic, focusing on how to build a dynamic Grafana Dashboard using Variables.
Static Panels and Dynamic Panels
Static Panels
In this context, static panels refer to panels where the content of the queries is “hard-coded.”
Imagine you want to monitor the load of your backend server backend_server_1 using Grafana. You hard-code backend_server_1 in the query, and it works fine. However, when one server is not enough to support your application, you might need to add backend_server_2, backend_server_3, etc. In this case, the initial query will become problematic, and you will need to modify the query every time you add or remove a server. This approach is cumbersome and not scalable.
Take the panel showing the star count changes of various repositories from the previous article as an example:
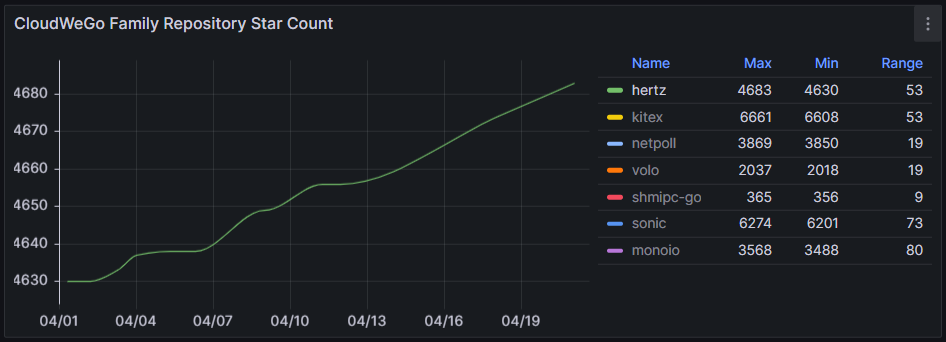
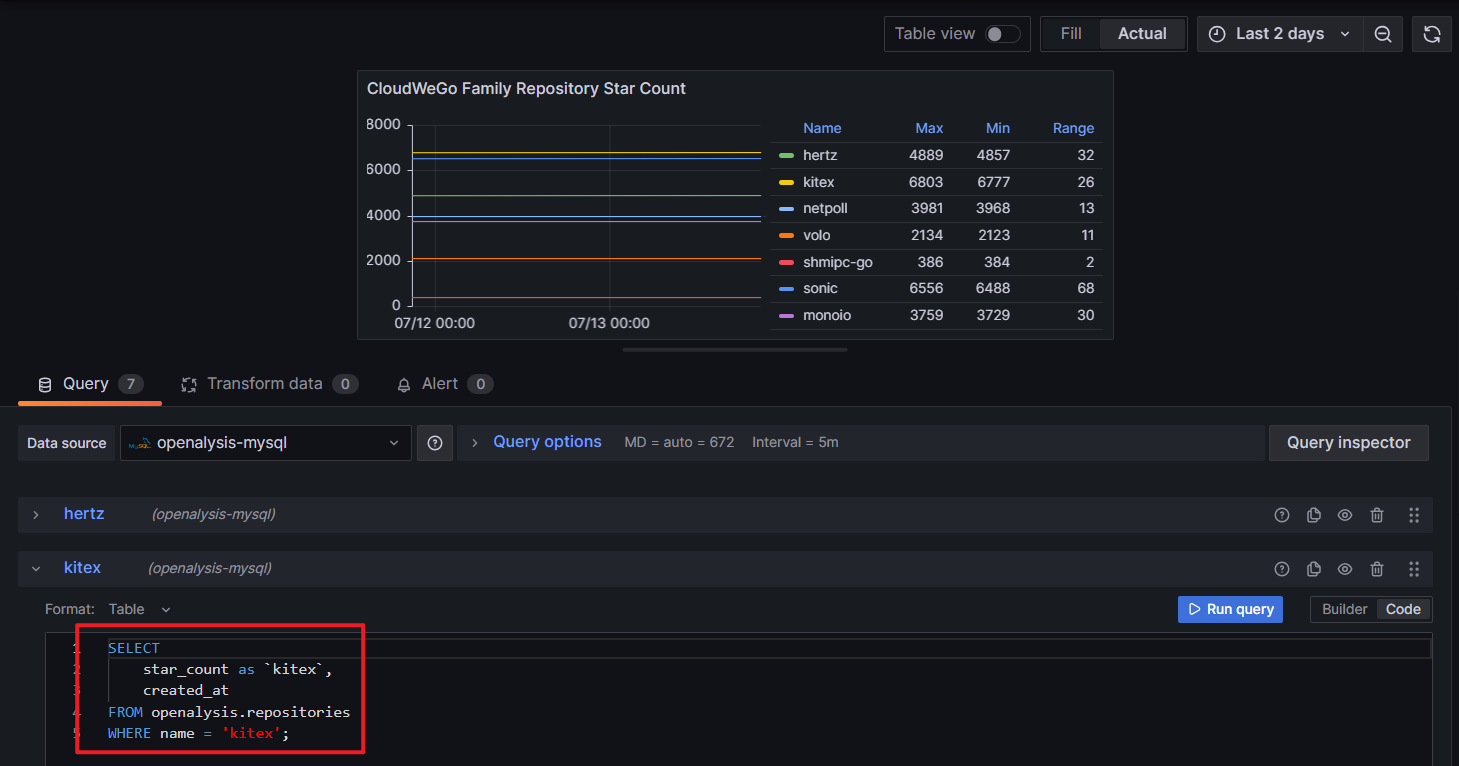
In the corresponding SQL query fetching data, the repository names are hard-coded. Such static panels are not advisable. Do not create such panels.
Dynamic Panels
By utilizing the Variables feature provided by Grafana Dashboards, we can easily create a series of panels that dynamically change based on the set variables.
Compared to static panels, dynamic panels are more flexible and natural by writing queries that adapt to different types of variables.
Creating Variables
Grafana Dashboard supports the creation of various types of variables (as shown in the table below). The methods of creation and usage are quite similar across different types. Here, we will mainly discuss Query type variables. If you want to learn about other types of variables, you can refer to the official documentation.
| Variable type | Description |
|---|---|
| Query | Query-generated list of values such as metric names, server names, sensor IDs, data centers, and so on. |
| Custom | Define the variable options manually using a comma-separated list. |
| Text box | Display a free text input field with an optional default value. |
| Constant | Define a hidden constant. |
| Data source | Quickly change the data source for an entire dashboard. |
| Interval | Interval variables represent time spans. |
| Ad hoc filters | Key/value filters that are automatically added to all metric queries for a data source (Prometheus, Loki, InfluxDB, and Elasticsearch only). |
| Global variables | Built-in variables that can be used in expressions in the query editor. |
| Chained variables | Variable queries can contain other variables. |
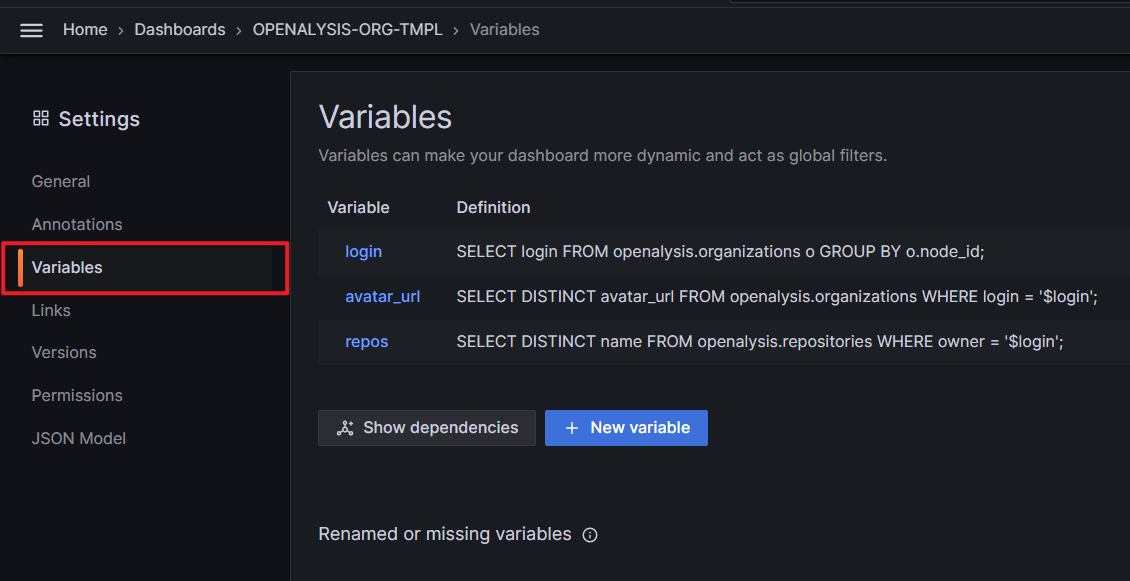
To create a variable, go to the Variables tab in the Dashboard Settings and click New variable.
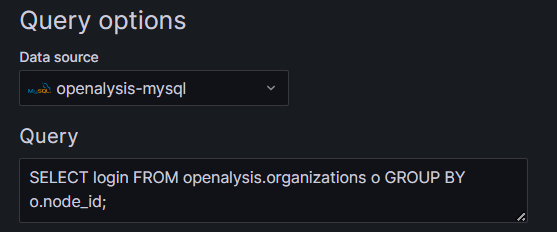
After setting the variable type to Query, we can write a query to set the actual value of this variable.
Here, we create a simple login variable to query the names of all GitHub organizations from the database. Since we use MySQL as the data source, we only need to write a simple SQL query.
The effect of the login variable after creation is as follows: all organizations are queried and displayed in a dropdown list, and we can select an entry as the actual value of the login variable.
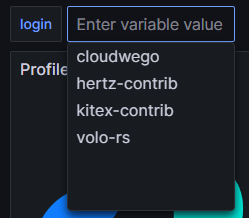
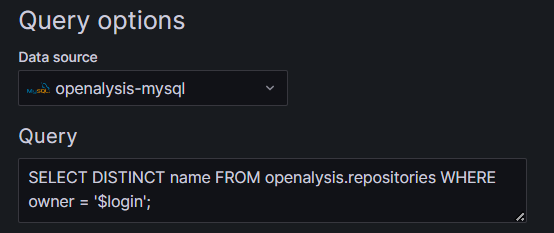
Variables can also reference each other. For example, if we want to create a repos variable that shows the names of all repositories under an organization, we can use the previously created login variable in the query for the repos variable using the $varname syntax. For more syntax for using variables, refer to the official documentation.
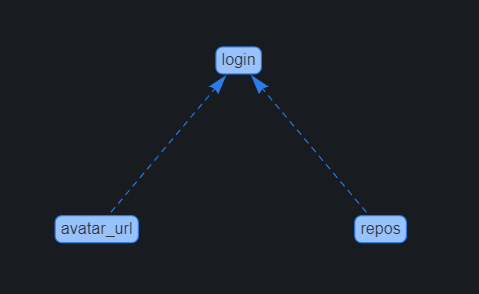
Through the Show dependencies option in the Variables tab, you can clearly see the dependencies between variables.
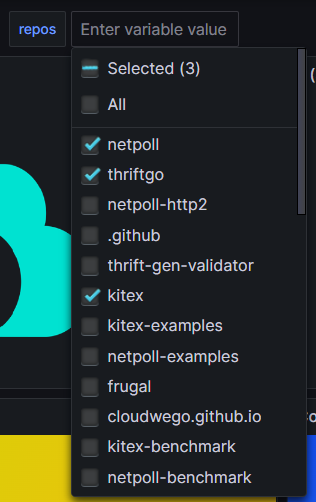
We can also choose to set multiple values as the actual value of a variable.
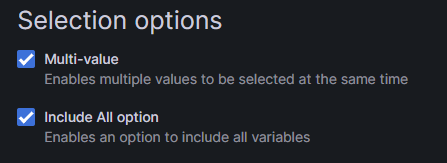
Now, with the Multi-value option enabled, we can select multiple repository names under a specific organization as the value of the repos variable by referencing the login variable.
Using Variables
To use variables, embed them in specific queries or expressions using the $varname or ${var_name} syntax, as we did when creating the repos variable.
To illustrate the flexibility and advantages of dynamic panels over static panels, let’s take the initial panel showing the star count changes of various repositories as an example. Now, we have the repos variable that can select multiple repository names under the organization chosen by the login variable and use them as the value of the repos variable. Thus, we can write our SQL query as follows:
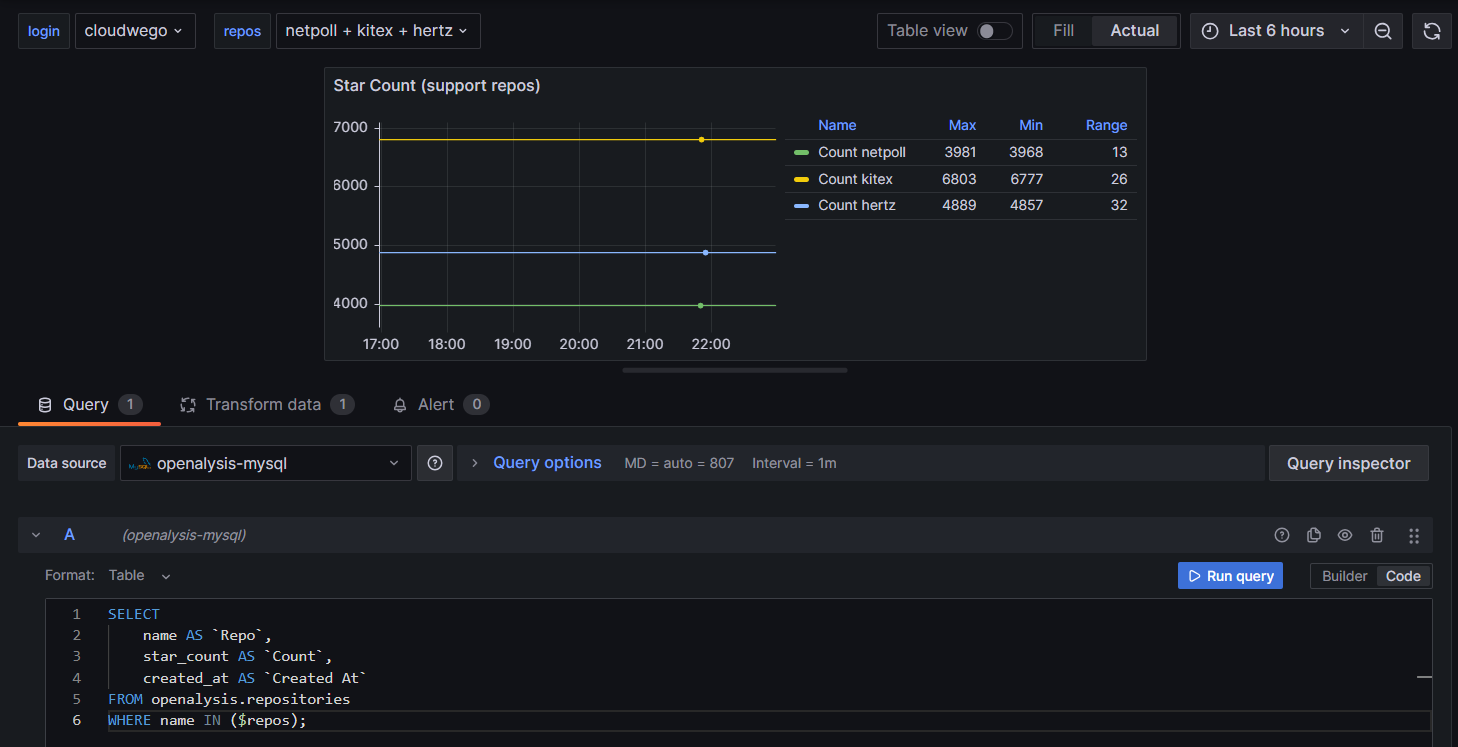
As shown in the figure:
- We selected
cloudwegoas the value of theloginvariable and chose thenetpoll,kitex, andhertzrepositories in thereposvariable. - In the SQL query, we used the
reposvariable with the$varnamesyntax. - Finally, our chart shows the star count change trends for the three selected repositories.
This approach is much more elegant than hard-coding the repository names in the query.
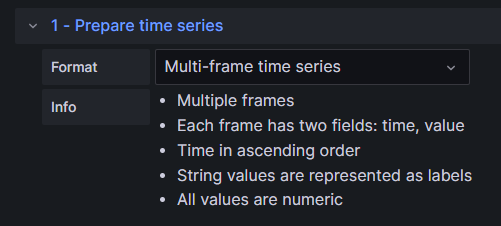
Another important point is that this usage requires adding an extra Transform to process the queried data. The Multi-frame time series Transform can use the returned string values as labels, enabling separate display of time series for each label.
Summary
That concludes this article. We have explored the use of Variables in Grafana Dashboard through practical examples, allowing us to easily create flexible dynamic panels.
By utilizing features like Grafana Dashboard Variables, the OPENALYSIS project can more flexibly perform visual analysis of the configured open-source community data. I believe this will help you better build and develop your open-source community.